|
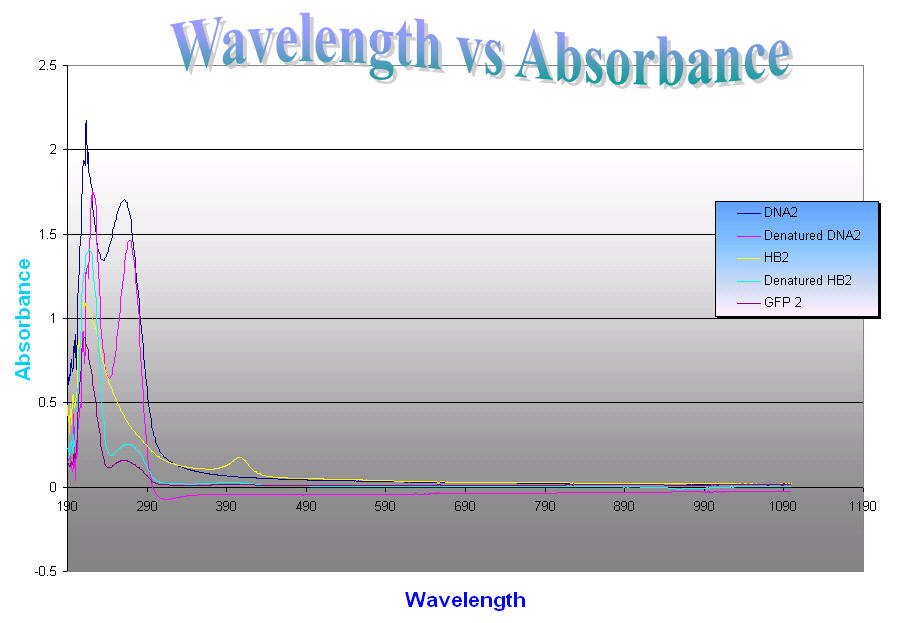
This graph is made up of two
curves of DNA and HB along with GFP. At the beginning of each
curve there is a little bit of noise which results in a more
jagged curve. The two DNA curves
are said to peak at about 260nm. The native DNA curve peaks at
two places, its highest peak is somewhere around 230nm while the
smaller peak is around 270nm. The denatured DNA also peaked into
places although its peaks are shifted to the right and not as
tall. In the denatured DNA the first peak is around 240nm
while the second, smaller peak is near 280nm.
The two Hemoglobin's curves have two
peaks. The first peak for both the nature and denatured is
around 230nm. The second peak of the native HB is around
420nm while the denatured HB has its second peak around 280nm.
The GFP also has two peaks but on the graph
it looks as if it is mimicking the denatured HB but with a
smaller absorbance. The GFP curve peaks around 210nm and
then 270nm. Although the predicted literature value for GFP is a
peak at 395nm and 475nm.
 |