After one hour the gel appeared as though it had run correctly. All of the loading dye (deep blue in color) ended up at the bottom of the gel box, below the actual gel. Before staining, the resulting colors for the K1 standard (loaded in Wells 2 and 8) were as follows: blue, red, green, purple, orange. The colors for K2 (Well 9) were: purple, orange, red, blue. K2 showed up much fainter than K1.
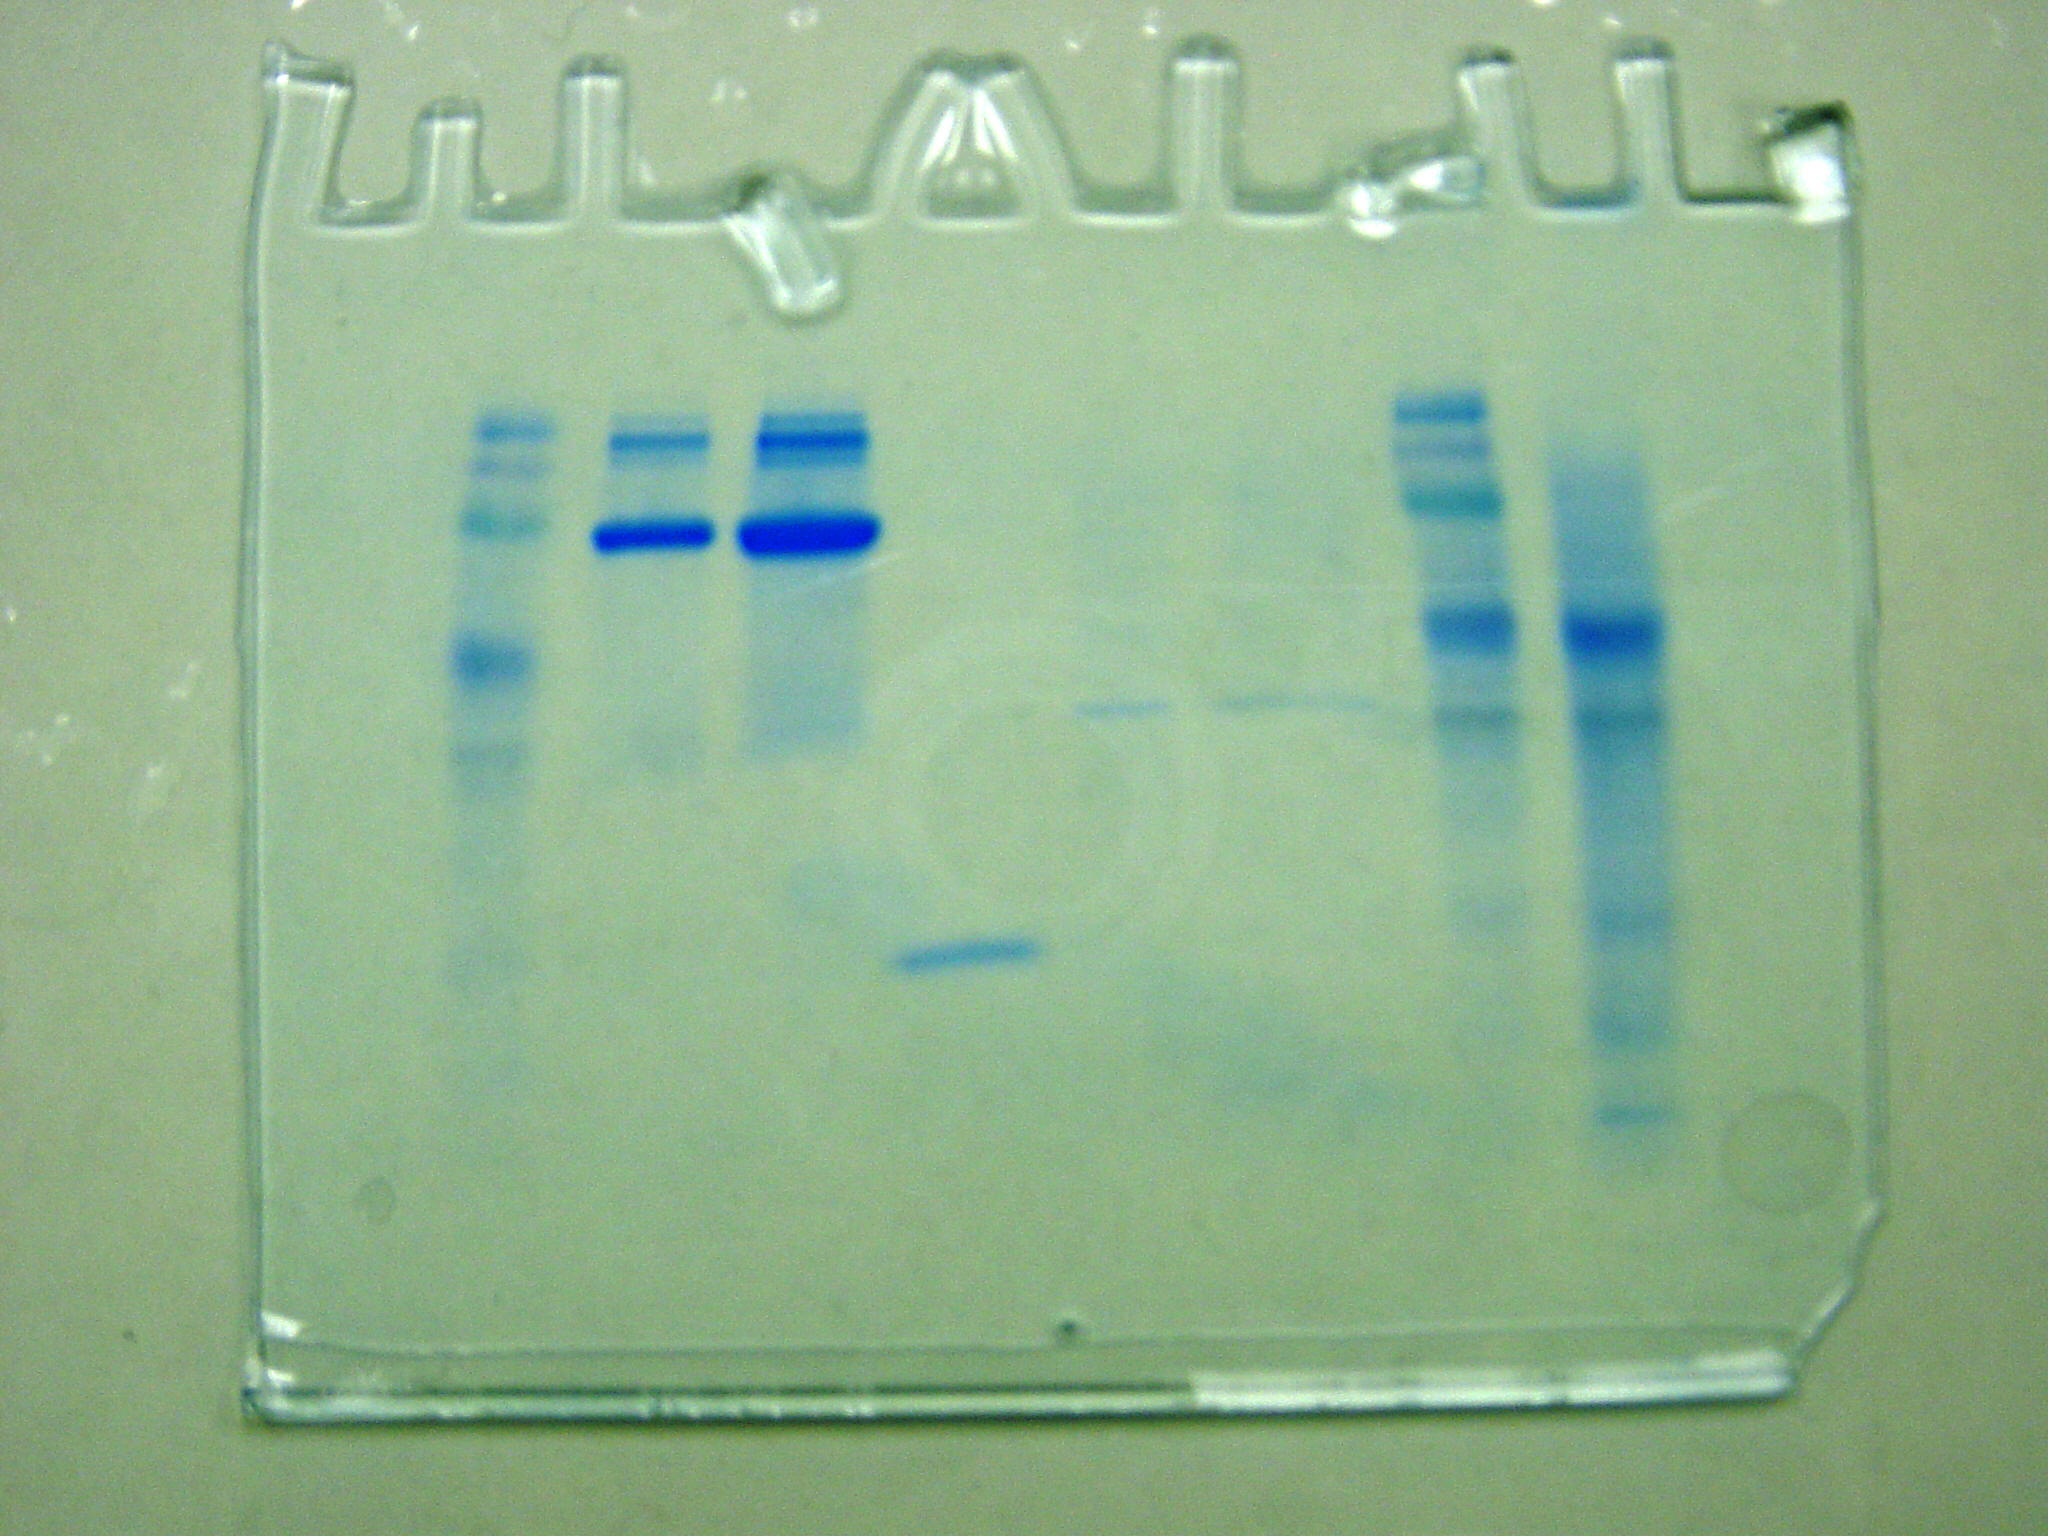
The gel was removed from the gel box and placed in a dye solution. The gel was then placed on a shaker for 24 hours, after which the excess dye was poured off and replaced with distilled water. The gel was returned to the shaker for 2 more days, until a photo could be taken:
|
|
The mobility of each protein was measured in centimeters (cm), relative to a common point on the gel. We measured from the bottom of each well to the protein band. If the band was thicker, we measured to the midpoint of the band. The values for each respective well and corresponding sample are below:
| 1 | 2 | 3 | 4 | 5 | 6 | 7 | 8 | 9 | 10 |
| empty | K1 | Known 1 | Known 2 | Size Ex 3 | Size Ex2 | HIC | K1 | K2 | empty |
| n/a | 1.4 | 1.4 | 1.4 | 1.82 | 1.8 | 1.8 | 1.4 | 2.6 | n/a |
| 1.5 | 1.5 | 1.5 | 3.0 | 3.0 | 3.0 | 1.5 | 3.2 | ||
| 1.9 | 1.6 | 1.6 | 4.4 | 1.9 | 4.4 | ||||
| 2.7 | 2.0 | 2.0 | 2.7 | 4.9 | |||||
| 3.3 | 3.1 | 5.4 |
The mobility of the Kaleidoscope Standards were entered into a Microsoft© Excel Spreadsheet and plotted against the log their molecular weight to form a standard. Two curves were plotted, one from the Prestained Standards (K1) and one from the Polypeptide Standards (K2).
|
|
|
On the Prestained Standards Curve, our Size Ex 3 (Well 5) had bands at 1.82, 3.0, and 4.4. Size Ex 2 (Well 6) had bands at 1.8 and 3.0. Our HIC (Well 7) had bands at 1.8 and 3.0. The molecular weights are shown in the table below, in Daltons:
| Size Ex 3 | Size Ex 2 | HIC | |||
| 1.82cm | 1.39 x 10¹¹ | 1.8 | 1.59 x 10¹¹ | 1.8 | 1.59 x 10¹¹ |
| 3.0 | 3.38 x 10⁷ | 3.0 | 3.38 x 10⁷ | 3.0 | 3.38 x 10⁷ |
| 4.4 | 1745.36 | ||||
On the Polypeptide Standards Curve, the mobility of each sample stayed the same, however, since the standard curve moved the equation of the line was altered. The molecular weights based on this new equation are in the table below, in Daltons:
| Size Ex 3 | Size Ex 2 | HIC | |||
| 1.82cm | 1.98 x 10⁹ | 1.8 | 2.21 x 10¹⁰ | 1.8 | 2.21 x 10¹⁰ |
| 3.0 | 3.5 x 10⁶ | 3.0 | 3.5 x 10⁶ | 3.0 | 3.5 x 10⁶ |
| 4.4 | 1944.35 | ||||
The molecular weight of GFP is approximately 27 x 104 Daltons. Our nearest measurements occurred on the Polypeptide Standards curve at Size Ex 3 @ 3.0cm, and 4.4cm; Size Ex 2 @ 3.0cm, and HIC @ 3.0cm.
The Polypeptide Standards curve spanned more of the gel than the Prestained Standards curve, leading one to believe it will be more accurate a measurement of the molecular weight of our GFP.