UV Spectroscopy Theories and Results
When molecules absorb radiation from the ultraviolet (UV) or visible region of the electromagnetic (EM) spectrum they undergo changes in their energies. The absorption of the EM radiation excites an electron and creates an excited state. The total energies that a molecule can have are also quantized; thus, energy changes occur at fixed energies. Different molecules absorb radiation of different wavelengths. An absorption spectrum will show a number of absorption bands corresponding to structural groups within the molecule. Any species with an extended system of alternating double and single bonds will absorb UV light, and anything with color absorbs visible light, making UV spectroscopy applicable to a wide range of samples. Here is a single-beam spectrophotometer:

Information and picture found at: http://www.sci.sdsu.edu/TFrey/Bio750/UV-VisSpectroscopy.html
The UV range extends from a wavelength range of 200 nm to 400 nm. The visible range extends from 400 nm-800 nm. Absorption of light in the visible produces color, while absorption of light in the UV can destroy molecules because of its high energy.
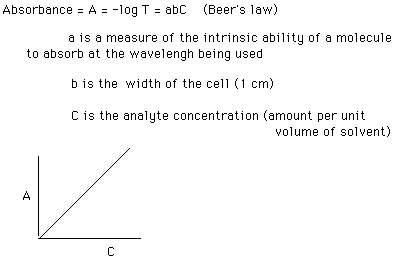
The problem with transmittance is that it decreases with increasing concentration of the sample dissolved in the solvent. It is easier if a measured parameter changes directly with sample concentration. As a consequence, a new term called absorbance is used:

Information and picture found at: fischer.union.edu/Chem20/ uvinfo.html
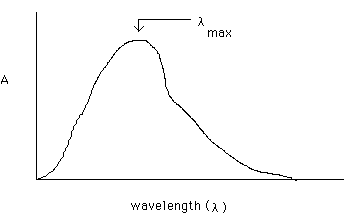
The plot of A vs. C, called a Beer's Law plot, shows the direct relation between the two. If C is doubled, so is the measured A value. An absorption spectrum of a molecule is therefore a plot of A (y axis) vs. wavelength (x axis):

Information and picture found at: fischer.union.edu/Chem20/ uvinfo.html
To do quantitative analysis on the molecule whose spectrum is shown above, an instrument called a UV/Visible spectrophotometer would be set to pass l max, the wavelength where sample absorbance is a maximum. A series of standard solutions would be prepared of known and increasing concentration of the sample, the A values would be obtained at l max for these solutions and a Beer's law plot would be constructed from these values. Then the A value at l max for a sample containing an unknown concentration of the sample would be measured. The concentration of the sample in the unknown can be determined from the Beer's plot of the standards and the unknown A value.
The concentrations of the B-galactosidase, GFP, Hemoglobin, and DNA were determined by using the above procedure. The absorbances were determined from the graphs found here. The concentration equals Absorbance/(the extinction coefficient*width of cell). The width of the cell is usually 1cm, so it can be disregarded for this experiment. To find the concentration (c) in molarity, simply divide the absorbance (A) by the extinction coefficient (a).
| Sample | A | a | c | |
| GFP |
|
30,000 | .000013672 | |
| Denatured DNA |
|
16,800 | .000033600 | |
| DNA |
|
16,800 | .000044015 | |
| Denatured Hemoglobin |
|
116,000 | .000003181 | |
| Hemoglobin |
|
116,000 | .000003851 | |
| B-galactosidase |
|
10,310 | .000050729 |
After determining the concentration, SDS-PAGE was performed on the sample. Click here for details and results.