UV Spectrum Comparisons
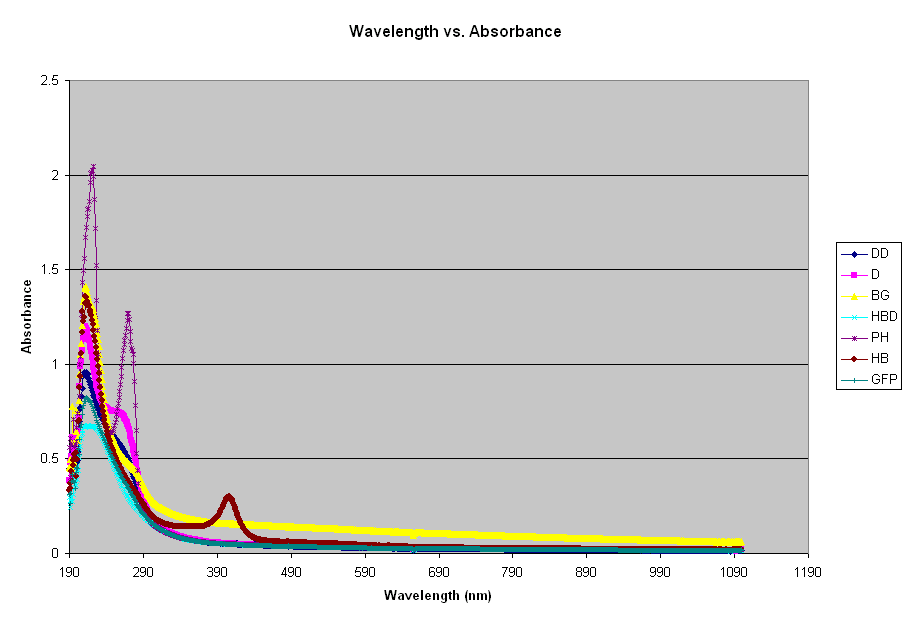
In the graph below, the absorbances of several samples were plotted against wavelength. To find the theory of UV Spectroscopy, click here. The absorbances taken were denatured DNA from Herring sperm (DD), DNA from Herring sperm (D), B-galactosidase (BG), Denatured hemoglobin (HBD), phenol chloroform isoamyl alcohol (PH), hemoglobin (HB), and green fluorescent protein (GFP).
There is a peak for all absorbances (DNA and protein) at approximately 200-300 nm. Below is the same graph, zoomed in at the 200-300 nm range.
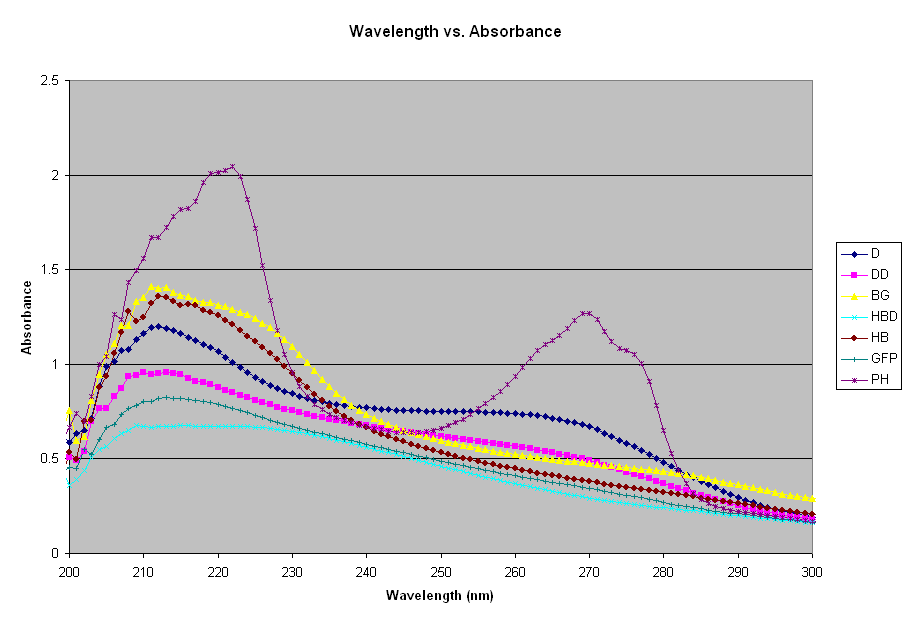
Most proteins have a distinct absorption maximum at 280 nm because of the presence of aromatic amino acids (especially tryptophan, tyrosine, and phenylalanine). Peptide bonds contribute to the absorbance in the 210-220 nm range while the disulphide bonds contribute to the absorption properties at 250-280 nm range. In theory, the protein absorbance can be calculated from the absorbance properties of the individual amino acids, if the content of the particular protein was known. Partially purified protein may contain nucleic acid that have an absorbance maximum at 260 nm.
Literature shows that GFP has an absorbance/excitation peak at 395 nm with a minor peak at 475 nm. Its emission peak is at 509, which at the peak of the lower green spectra of visible light. GFP seems to peak at approximately 215 nm in this graph.
DNA has a peak at 210 and a plateau at 260. A 50 ug/ml sample of DNA will give a reading of 1.0 at 260 nm. In its native state, DNA exists as a double-stranded helix held together by hydrogen bonds between the opposing nitrogenous bases on the two strands. When DNA is denatured, the hydrogen bonds are broken, the strands separate, and the absorbance at 260 nm increases. The denatured DNA follows the exact line, except at a lower absorbance. Although one would expect the denatured DNA to be at a higher absorbance (because of its entropy), it was not so with this experiment. The denatured DNA was not the same sample as the DNA, meaning they do not have the same concentration. This explains why they are not at the correct relative absorbances.
Hemoglobin has a peak absorbance around 556 nm. In the graph above, it peaks at 210-220. Again, the denatured sample is lower than the native protein. The hemoglobin was prepared using two samples, then denatured. Next time, an absorbance will be taken using the original sample. B-galactosidase has a large hump that extends from 210 to 230 nm. In the graph above, it was the second strongest absorbance reading, second only to phenol. Phenol has a large peak at 220 nm, over 2.0.
For more information about the theory and technique of UV Spectroscopy, click here. After finding the concentrations of the protein, a SDS-PAGE was run on the protein. Click here for results and pictures.